Hooke's Law experiment by Firas Baroum
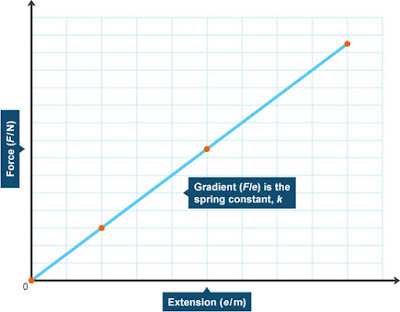
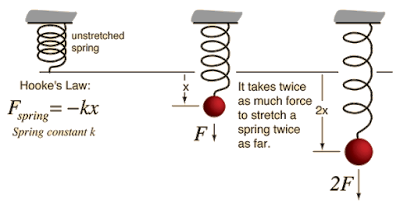
Hooke's Law : "when an elastic object - such as a spring - is stretched, the increased length is called its extension. The extension of an elastic object is directly proportional to the force applied to it"(1) , ( F = kx ) or as shown in (Figure 1) ( F = ke ) "This equation works as long as the elastic limit (the limit of proportionality) is not exceeded"(1) , where :
F : is the force in newtons, N
k : is the 'spring constant' in newtons per meter, N/m
x : is the extension in meters, m
an example of Hooke's Law is presented in (Figure 1) below :
 |
| (Figure 1)(1) |
 |
| as stated above the extension of the elastic object is directly proportional to its Force (2) |
The aim of the following experiment is to investigate the behaviour of three materials : y1 , y2 , and z in respect to Hooke's Law.
 |
| Table 1 |
Considering the values of x and y1 to be as given in (Table 1) and using these three equation : (y1 = ax + b) eq1 , [y2 = (a + 0.5)x + c] eq2 and (z = x^3 +b) eq3 , where c = 0.2 .
a and b values were obtained from using x and y1 values in Excel and plotting them in (Table 1) ,
then subsitutting them in eq2 to complete the graph of y1 and y2 shown below (Figure 2)
 |
| (Figure 2) y1 vs x and y2 vs x |
Which enabled the use of the two simultaneous equation in (y1 = y2) to find the point where the two lines intersected : 1.5583x + 1.375 = 2.0583x + 0.2 => x = 2.35
and then substituting x in either y1 or y2 [ y2 = (2.0583*2.35) + 0.2 ] y2 = 5.037
which mean that ( 2.35 , 5.037 ) is the point where the two lines intersected.
Finally using eq3 the graph of z versus x was plotted in (Figure 3) :
 |
| (Figure 3) z vs x |
In relation to Hooke's Law , x is the Force applied (Newton) where as y1 , y2 , and z are the deformation , and k is the gradient (F , x).
y1 and y2 are two different elastic materials but they were both still in their linear elastic region (Figure 2) , also y2 is more elastic than y1 because they both had equal amount of x ( Force ) , but it had higher deformation than y1.
, where as z has gone past its elastic region to the ( plastic region ) which means it is no longer a linear elastic region (Figure 3).
Errors : probably the numerical value for x and y1 might haven't been that accurate that could possibly be because of reading/writing the wrong number when stating both of their values.
As well as while calculating the numbers in excel there is a chance of mistyping a number.
"I am aware of the requirements of good academic practice and the potential penalties for any breaches".
No comments:
Post a Comment